
Web Platform Speed vs. Customer Bounce Rate: The Direct Impact of Performance on Revenue
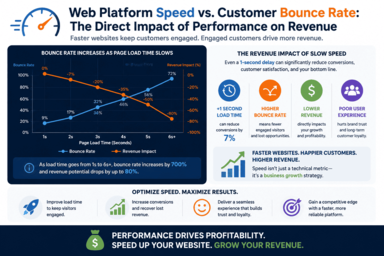
Executive teams often treat website speed as a minor technical detail best left to IT departments. They invest heavily in digital marketing campaigns, high-converting ad copy, and brand design, while ignoring slow page response times.
This disconnect negatively impacts revenue. Every second spent waiting for a web page or application dashboard to load increases drop-off rates, erodes ad spend ROI, and reduces user conversion rates.
Page Load Time vs. Conversion Rate Decay (Industry Average)

Conversion
  Rate (%)
   8% |  *
   6% |     *
   4% |        *
   2% |           *
   0%  --------------------------------------->
      1s    2s    3s    4s    5s    6s
                 Page Load Time (Seconds)
Modern web application design links load speed directly to top-line performance: System responsiveness directly dictates user retention and customer conversion.
Core Web Vitals: Translating Performance Metrics to Business Value
 ------------------ ---------------------------------- ------------------------------------
| Technical Metric | What It Actually Measures        | Financial Impact of Failures       |
 ------------------ ---------------------------------- ------------------------------------
| LCP              | Time required for primary        | High bounce rates from inbound     |
| (Largest Content | visual content to appear.        | ad campaigns.                      |
|ful Paint)        |                                  |                                    |
 ------------------ ---------------------------------- ------------------------------------
| INP              | Speed at which the page responds | Abandoned checkouts & unsubmitted  |
| (Interaction to  | to user clicks or inputs.        | inquiry forms.                     |
| Next Paint)      |                                  |                                    |
 ------------------ ---------------------------------- ------------------------------------
| CLS              | Visual stability of elements     | Accidental clicks, user confusion, |
| (Cumulative      | while the page loads.            | and transaction errors.            |
| Layout Shift)    |                                  |                                    |
 ------------------ ---------------------------------- ------------------------------------
The Anatomy of Bloat: Why Off-The-Shelf Templates Fail
Most corporate websites perform poorly because they rely on generic site builders, pre-made themes, and dozens of overlapping third-party scripts.
Off-The-Shelf Monolithic Site:
[ Unoptimized Theme ]   [ 25 Active Plugins ]   [ 5 Analytics Scripts ] = 4.8s Load Time

Custom High-Performance Architecture:
[ Lean Custom Frontend ]   [ Direct API Backend ]   [ Strategic Caching ] = 0.6s Load Time
- Unused Code Overhead: Pre-built templates include thousands of lines of unused CSS and JavaScript designed to support features your business never uses.
- Plugin Conflicts: Adding third-party plugins for simple features (like popups or form handling) creates database queries that slow down server response times.
- Unoptimized Assets: High-resolution uncompressed images and un-cached media files exhaust user bandwidth, especially on mobile devices.
Engineering for Speed: The Custom Performance Advantage
Building high-performing web platforms requires deliberate architectural choices that prioritize efficiency at every layer:
- Headless Infrastructure: Decoupling the frontend interface from backend database engines ensures user-facing pages load instantly from edge delivery networks (CDNs).
- Database Query Optimization: Structuring database requests cleanly prevents server bottlenecks during traffic spikes.
- Aggressive Server-Side Caching: Serving dynamic application content via optimized cache layers minimizes redundant background processing.
Quantifying the Speed Dividend
Optimizing platform performance delivers immediate financial returns across key channels:
Recovered Revenue = Monthly Visitors × Current Conversion Rate × Speed Uplift % × Customer Lifetime Value
When you cut page load times down to sub-second speeds, you lower customer acquisition costs, improve organic search ranks, and maximize revenue from existing user traffic.
Related Articles